Our Blog
-
You are here:
- Home /
- Our Blog /
- Blog Business Intelligence /
- Connect Excel to Power BI for Faster Data Analysis

Do you find that standard Power BI reports do not always organize the data the way you need for financial analysis? Or do you prefer working in Excel but dread the repetitive task of exporting data from source systems day after day? Connecting Excel to a Power BI semantic model allows you to streamline your analysis, saving time and ensuring that your work is always based on accurate, real-time data from a single source of truth.
This integration combines the power of Power BI’s centralized, consistent datasets with Excel’s familiar tools like PivotTables and formulas. It enables you to create refreshable, customizable reports within Excel, eliminating the need for manual exports and providing the flexibility to explore data in ways that answer your specific questions. Whether you are analyzing variances, reconciling accounts, or generating ad hoc reports, this connection bridges the gap between Power BI's robust modeling and Excel's flexibility.
Imagine you are a financial analyst preparing a monthly sales variance report. A Power BI dashboard provides a high-level overview of regional sales but lacks the granularity necessary to compare product-level sales against budget forecasts. Instead of exporting data to Excel and building the analysis from scratch, you connect directly to the Power BI semantic model from Excel.
Within minutes, you create a PivotTable that pulls sales data from the Power BI dataset and add budget data from another table in the same model. You can group sales figures by product categories, apply filters for key regions, and calculate the variance between actuals and forecasts using Excel’s formulas. Best of all, the report is refreshable—when next month’s data is updated in Power BI, you simply refresh the Excel report, saving hours of manual work.
By integrating Excel and Power BI, this use case illustrates how you can perform detailed, ad hoc analyses while ensuring accuracy and consistency. This process does not require writing any Power BI DAX code or Power Query queries. In the following sections, we will guide you through setting up this connection and maximizing its potential for your business.
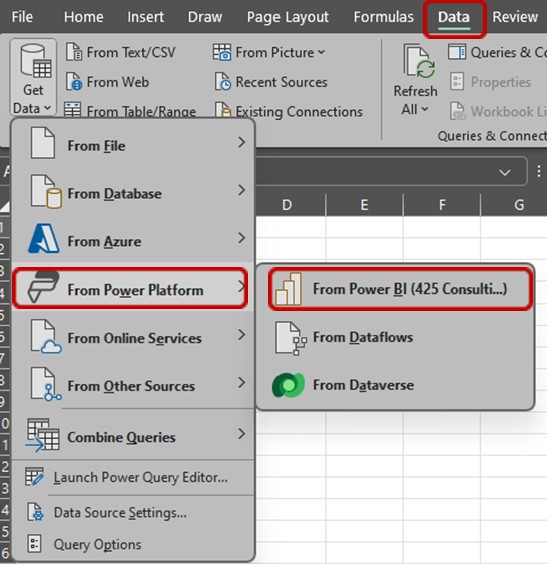
Now that we have described the steps to connect Power BI semantic models to Excel covered, let us take a closer look at how this integration works.
 |
Understanding the technology behind the connection helps you make the most of its features, from secure data sharing to flexible operations. In the next section, we will explain the basics of how Power BI and Excel interact, including read-only and read-write options, as well as cross-tenant connectivity for collaboration.
|
Additional Notes
Let us take a final moment to explore additional notes and tips to help you maximize the value of this connection, including key use cases and potential limitations to keep in mind.
By following these steps, you can unlock the full potential of integrating Power BI and Excel, enabling seamless data analysis and collaborative workflows across platforms.
The integration between Power BI and Excel enables users to leverage real-time, consistent data while maintaining the flexibility to conduct tailored analyses within familiar tools. Users are now able to perform in-depth data modeling and gain valuable insights without leaving Excel.
In addition, this process will eliminate the need for manual data imports and exports, saving time and reducing the risk of errors from “manual” data handling.
Teams can collaborate more effectively by sharing Excel workbooks that are connected to a centralized Power BI dataset. Any updates to the data in Power BI are automatically reflected in the Excel workbooks, keeping everyone on the same page.
With an Excel dashboard connected to Power BI you now have a connected, consistent, and tailored solution that is easily shared and updated with little to no need for in-depth knowledge of a new tool or coding language.
Reach out to our team of business intelligence experts if you need assistance with setting up or maximizing your Power BI reports.

Kenny leverages the power of Microsoft Power BI and Power Apps to transform businesses for growth. He converts complex data into actionable insights by creating visually appealing reports that uncover hidden trends and drive informed decision-making.
If you want to learn more about 425 Consulting Group can transform your business, please contact us.